Exploring ESMFold2 for Nanobody Complexes
Five known nanobody-antigen complexes, predicted from sequence alone. We examine the interfaces ESMFold2 recovered, the variation across seeds, and what the difficult cases reveal.
- Evidence type
- Crane model exploration
- Published
- August 2026
Two sequences, one structural question
How much can ESMFold2 recover about the way a nanobody and its antigen fit together, starting from their sequences? We explored that question on five complexes with known experimental structures. The references let us inspect the predicted interfaces and measure where the model succeeded or missed.
At Crane Bioworks, our contribution was to run the model on this selected panel, compare its predictions with the references, and assemble the structures and scores into an inspectable report. We wanted to see what the model recovered and where a closer look changed the interpretation.
- Known complexes
- 5
- Structure predictions
- 15
- High-quality interfaces, highest-ipTM selection
- 3 / 5
What ESMFold2 brings to complex prediction
ESMFold2 was developed by the Biohub AI Research team, with contributions from the former EvolutionaryScale team. We thank the authors for making the model and code available. The paper by Candido et al. (2026) and the Hugging Face model card describe the model and its broader antibody-complex benchmarks.
ESMFold2 combines representations from the ESMC-6B protein language model with a diffusion-based structure module. The language model supplies information learned from protein sequences; the structure module produces atomic coordinates. It supports protein-complex prediction with optional multiple sequence alignment (MSA) input.
We explored the single-sequence mode of ESMFold2. Each input contained a VHH nanobody sequence and an antigen sequence, without an MSA, template, or structural hints. The learned sequence information is still present. The authors report that inference-time compute affects accuracy, especially for antibody-antigen complexes. Our three-seed study explores one configuration; it does not measure the model's performance ceiling.
A five-complex sequence-only experiment
We used five VHH nanobody-antigen complexes, with three random seeds per target and 15 predictions in total. Each prediction was scored against its experimental reference with DockQ 2.1.3, which measures interface agreement. All five pairs are known binders. This tests recovery of their binding poses; it does not test whether the model can distinguish binders from non-binders or predict affinity, specificity, function, or developability. We performed no additional binding experiments.
DockQ's conventional quality bands start at 0.23 for acceptable, 0.49 for medium, and 0.80 for high. We also inspected contact recovery and pose displacement, because a benchmark label alone does not tell us whether a structure answers the biological question.
The entries postdate the model card's reported training cutoff. The selection record and the limits of that date split are set out with the data below.
Three interfaces recovered at high quality
The highest-ipTM predictions recovered high-quality interfaces for Cofilin-1, Neuronal pentraxin-2, and Oncostatin-M. The other two targets show why it is useful to inspect the individual structures: one was acceptable by DockQ despite a large pose displacement, and one was incorrect. Each row shows the seed with the highest ipTM, the model's confidence in the inter-chain arrangement. This selection does not use the experimental reference.
| PDB | Antigen | Deposited | Released | Selected seed / DockQ | ipTM | Quality |
|---|---|---|---|---|---|---|
| 9H1F | Cofilin-1 | 2024-10-09 | 2025-03-19 | Seed 0: 0.916 | 0.88 | High |
| 9LAD | Neuronal pentraxin-2 | 2025-01-02 | 2025-12-10 | Seed 1: 0.866 | 0.89 | High |
| 9VWO | Oncostatin-M | 2025-07-17 | 2026-07-22 | Seed 2: 0.823 | 0.78 | High |
| 9UO0 | Spike glycoprotein | 2025-04-24 | 2026-04-29 | Seed 1: 0.277 | 0.55 | Acceptable |
| 9E7O | Gametocyte surface protein P230 | 2024-11-03 | 2025-07-30 | Seed 2: 0.006 | 0.11 | Incorrect |
Across all 15 runs, 9 clear DockQ 0.23. The overlays below use best-DockQ examples to inspect structural agreement. Those are retrospective selections using the known reference.
Different seeds can tell different stories
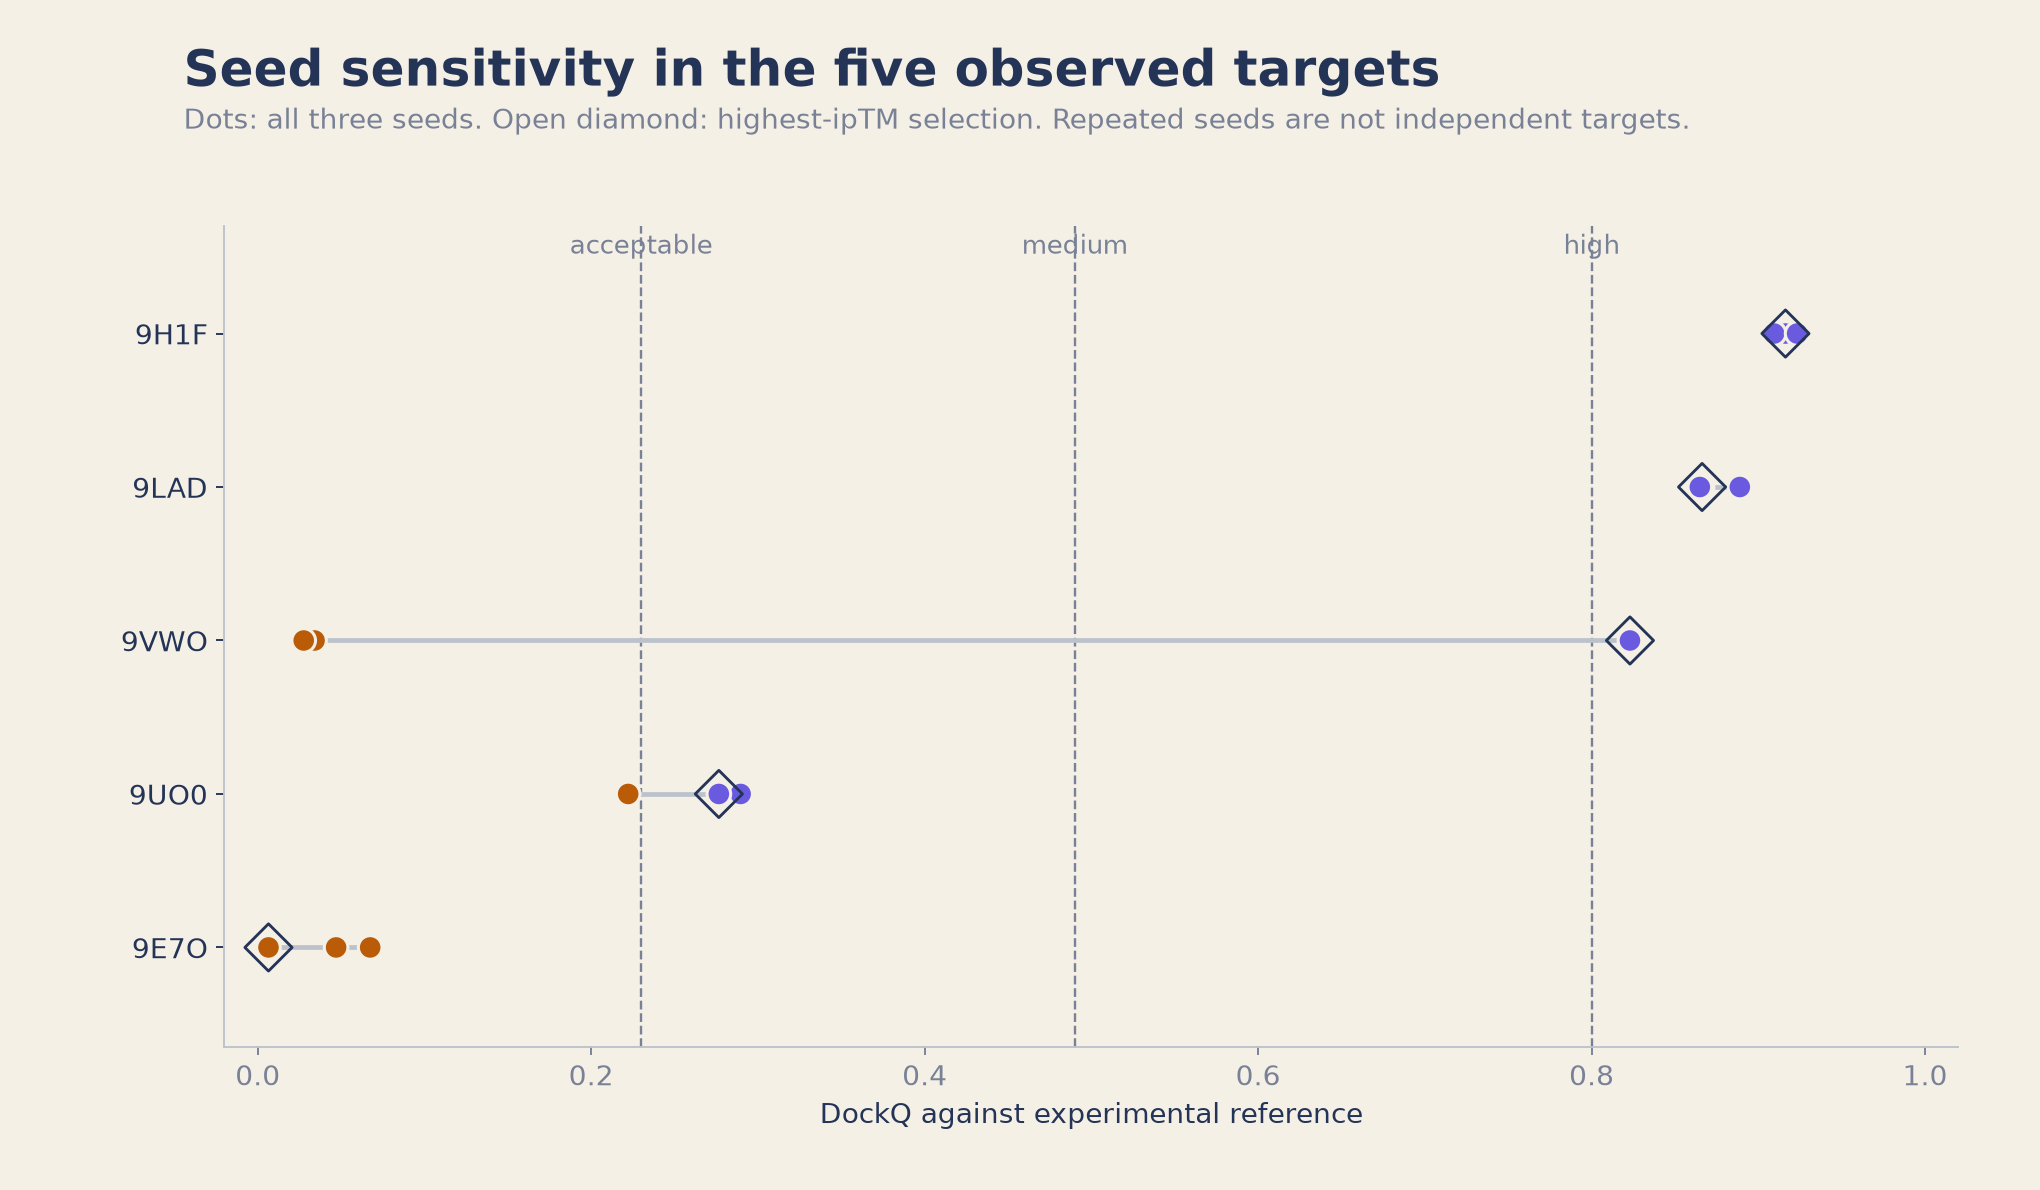
9VWO, the Oncostatin-M complex, gave two incorrect predictions and one high-quality result. Seeds 0 and 1 scored about DockQ 0.03, with almost no native contacts recovered. Seed 2 reached DockQ 0.823. Looking at only one of these predictions could have given a very different impression of the model on this target.
The highest-ipTM seed was also the most accurate: 0.78 for the correct seed against 0.17 and 0.15 for the two failures. These three observations show seed sensitivity, but do not estimate a success probability or establish how many seeds another target needs.
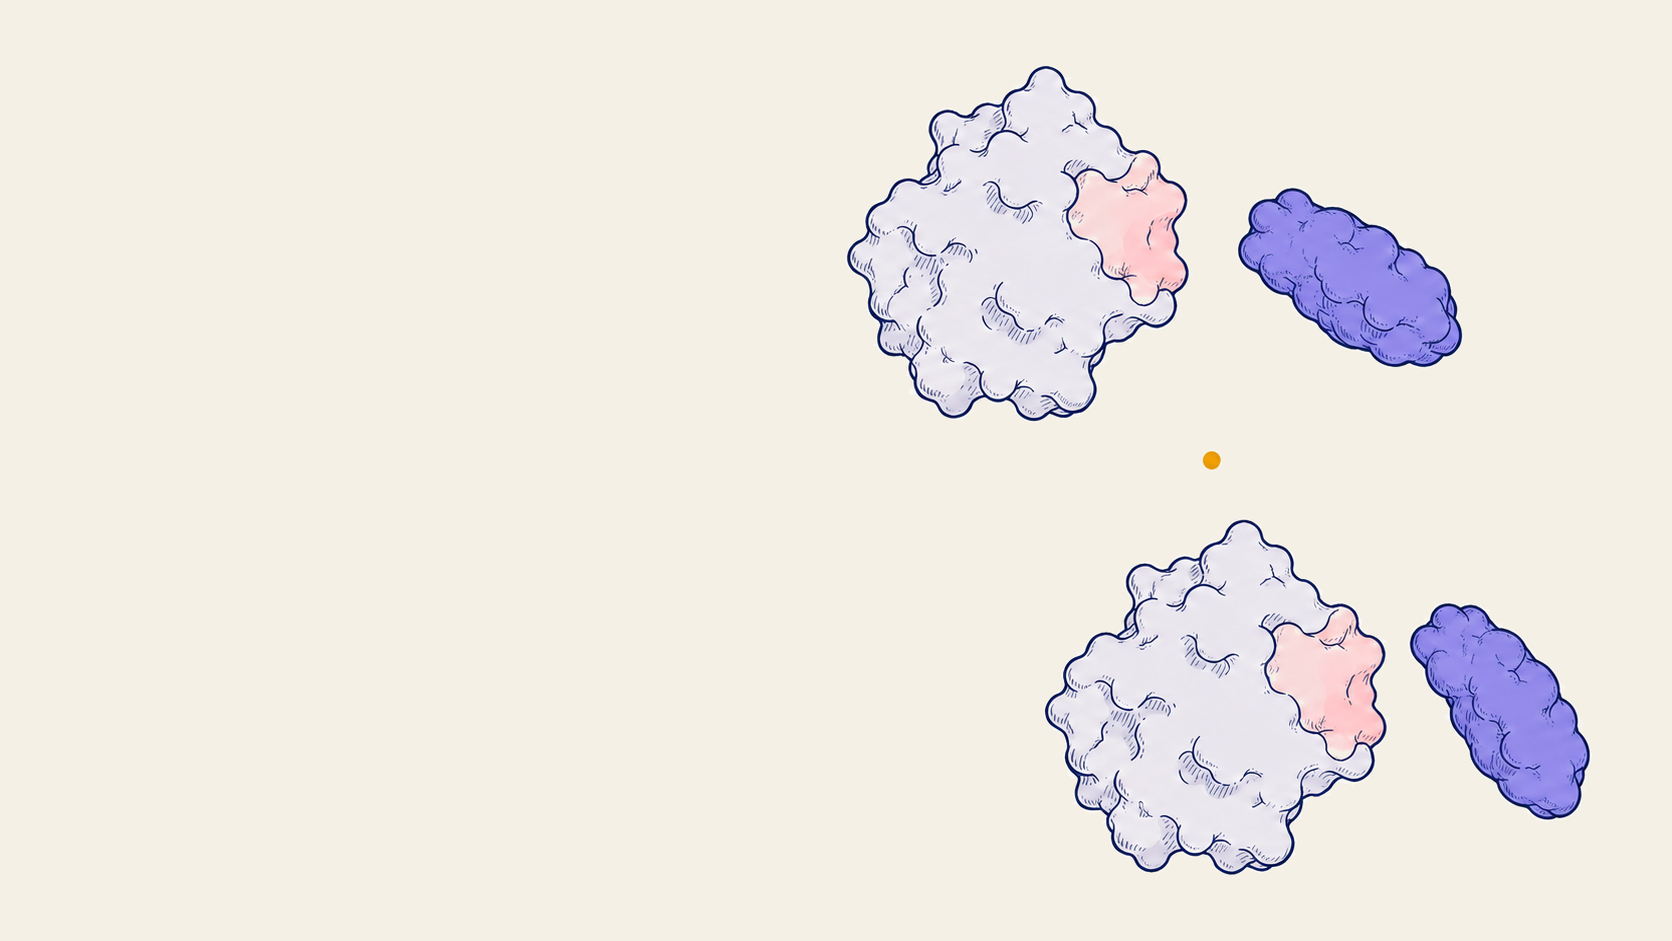
Conceptual illustration
Same partners, different poses
Different seeds can propose different arrangements of the same two partners. These sketches illustrate that question; the plot above shows the observed results.
Two kinds of difficult result
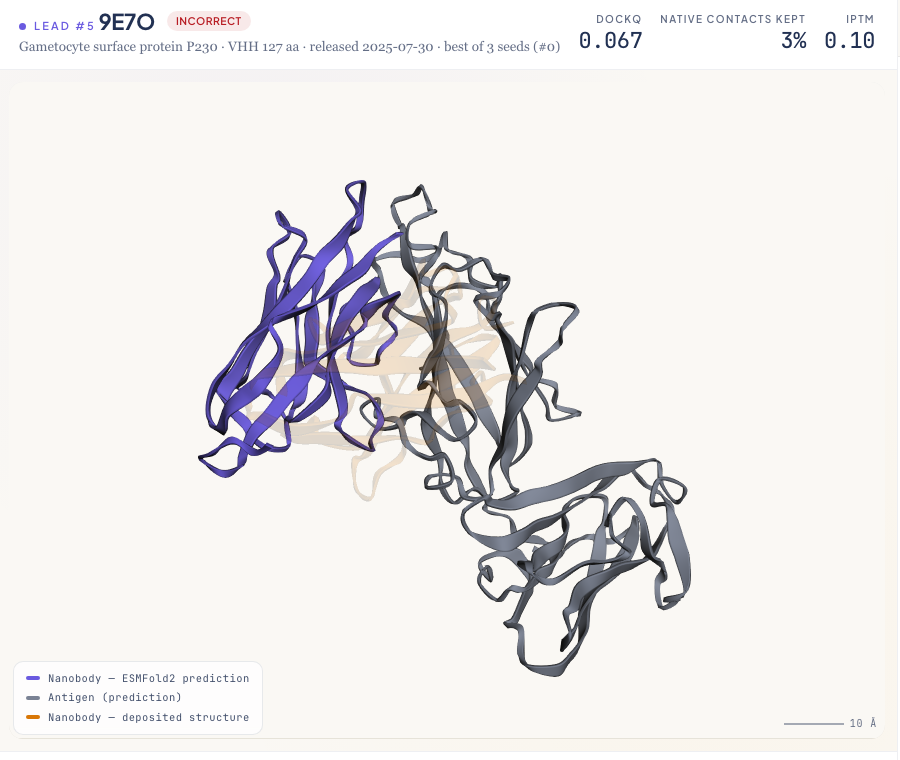
9E7O, gametocyte surface protein P230. All three predictions were incorrect. The complex-wide mean pLDDT, a local confidence measure, stayed around 72, while ipTM was only 0.09 to 0.11. That average does not establish confidence or accuracy for either individual chain. We did not assess their folds separately.
9UO0, the MERS-CoV spike receptor-binding domain. The three predictions straddled the acceptable boundary, at DockQ 0.22 to 0.29. The highest-ipTM seed reached DockQ 0.277 but retained a large pose displacement, with ligand RMSD 18.6 Å. The benchmark category needs that structural context.
Its best-DockQ seed keeps 66% of the native contacts, yet has ligand RMSD 20.6 Å. Partial contact recovery can coexist with a large pose error. The antigen structure also differs from the deposited reference, complicating the comparison. These results do not establish an accurate epitope assignment or atomic binding pose, and an incorrect prediction does not mean the known pair cannot bind.
Inspecting the predicted interfaces
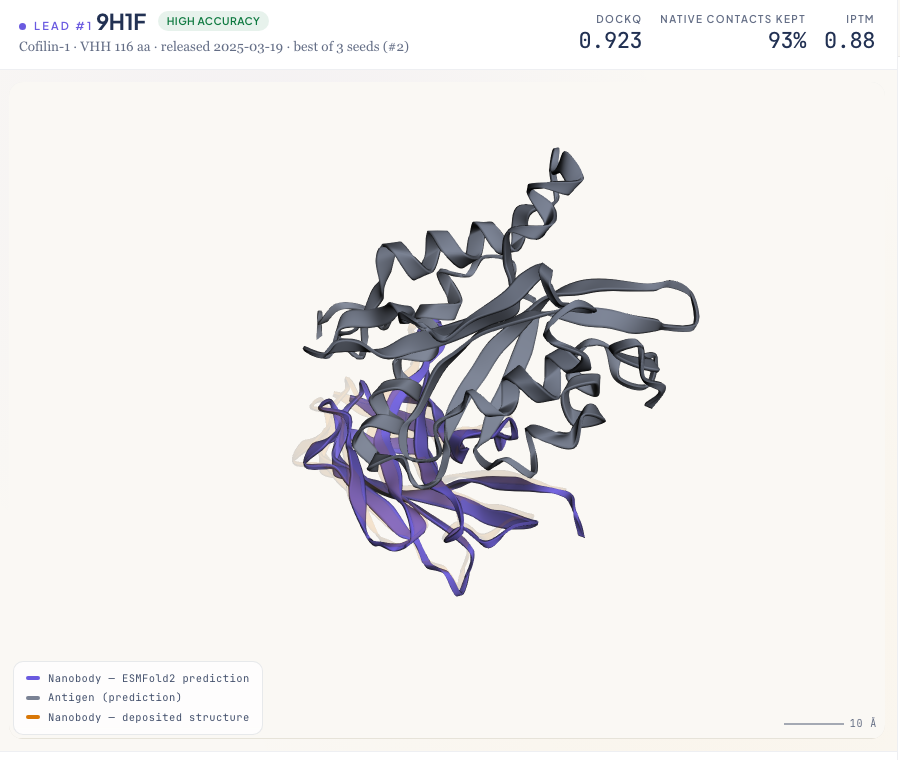
The overlays make the structural differences easier to inspect. Each deposited nanobody is superposed onto the prediction through the antigen. This sequence-matched C-alpha fit is illustrative and differs from DockQ's backbone alignment.
On 9H1F, the amber reference and violet prediction nearly overlap. On 9E7O, they occupy different faces of the antigen. The fit and centroid-offset details are in the supporting analyses below.
What confidence adds to the structural picture
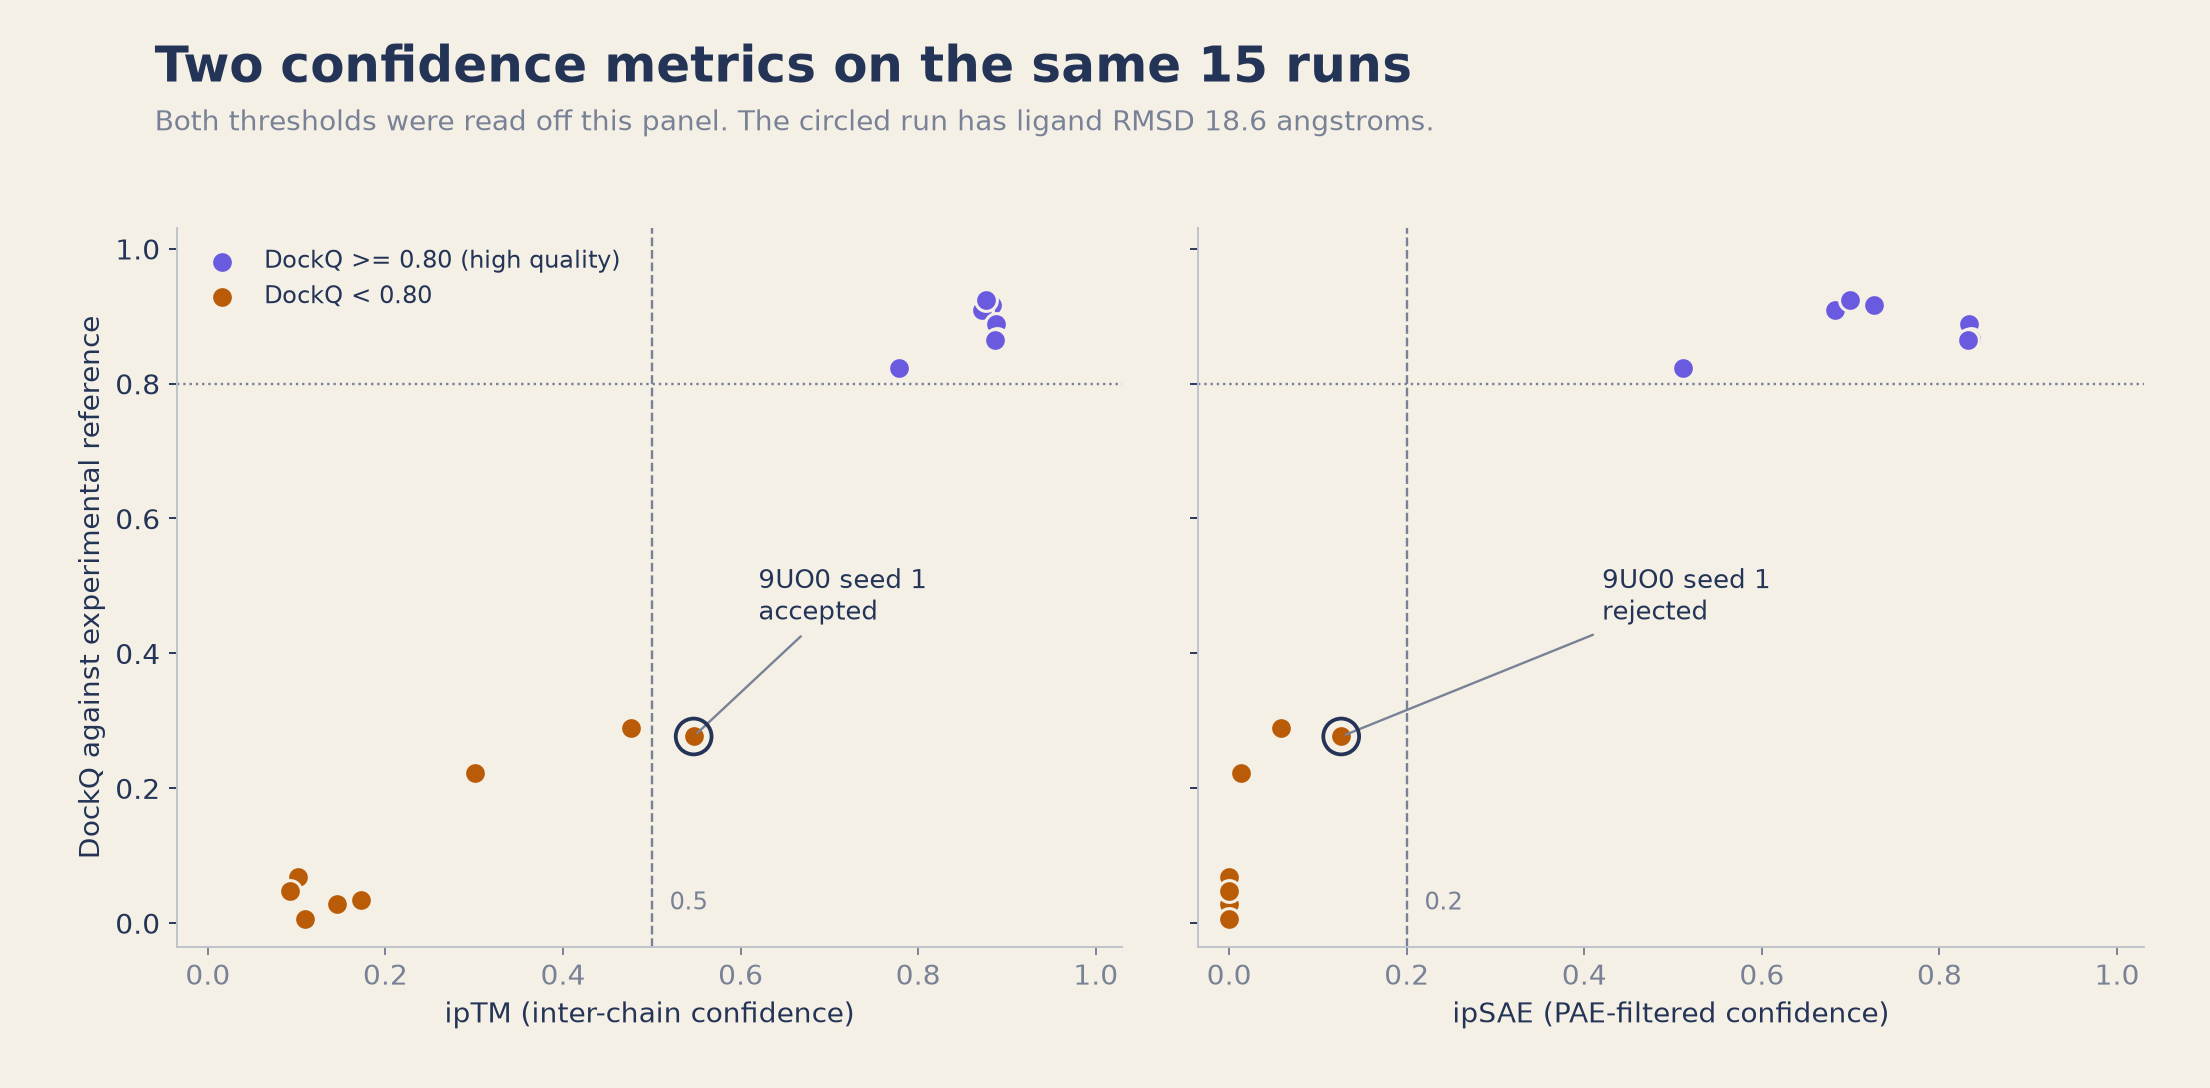
Can confidence help identify the more accurate predictions? ipTM already measures inter-chain confidence. We also computed ipSAE from the saved predicted aligned error (PAE) matrices. It retains inter-chain residue pairs below a PAE cutoff and adjusts length normalization; those pairs need not be physical contacts. See Dunbrack's ipSAE method.
Both metrics separate the seven high-quality runs from the other eight on this panel. ipTM tracks DockQ at Pearson r = 0.98, with rank correlation 0.84; ipSAE reaches Pearson r = 0.97 and rank correlation 0.87. Their different scales and these small correlation differences do not establish that either metric performs better.
The 15 runs are 5 targets sampled 3 times each, not 15 independent complexes. Both thresholds were chosen by examining this panel and evaluated on the same data. The table describes those observations; it is not a validated operating rule or an estimate of prospective performance.
| Gate | Runs accepted | DockQ ≥ 0.23 | DockQ ≥ 0.80 | Ligand RMSD > 10 Å |
|---|---|---|---|---|
| ipTM ≥ 0.5 | 8 | 8 | 7 | 1 |
| ipSAE ≥ 0.2 | 7 | 7 | 7 | 0 |
The cutoffs disagree on one run: 9UO0 seed 1 has ipTM 0.547 and ipSAE 0.126, with ligand RMSD 18.6 Å. Excluding it leaves only high-quality runs, but also loses a target: the ipSAE rule accepts three of the five targets, compared with four for ipTM. This is a difference between the chosen cutoffs, not evidence that ipSAE uniquely detects the error.
In this panel, confidence helps organise the predictions for inspection. The disagreement is useful because it brings us back to the structure: an acceptable DockQ score can still accompany a displaced pose. The threshold sweep is included below for readers who want to examine how the accepted subset changes.
What this exploration leaves open
ESMFold2 recovered three high-quality interfaces from sequence alone in this selected panel. There is no paired MSA-conditioned arm, so this study cannot measure what an MSA would change. It also does not establish a speed or cost advantage and cannot establish an antibody-specific advantage for single-sequence prediction.
We tested VHH nanobodies only, no Fab or scFv. There was no head-to-head against other co-folding models. A broader comparison would need matched targets and evaluation conditions, with additional antibody formats assessed on their own evidence.
The next study should also evaluate confidence rules on targets separate from those used to choose them, with the required pose quality specified in advance. That would test whether the patterns seen here transfer beyond these five complexes.
Explore ESMFold2 on your research question
At Crane, we help turn a structural question into a model study you can inspect. For a nanobody project, that can mean a report comparing predicted poses across seeds, confidence readouts, and agreement with any available experimental references, with the limits documented alongside the results.
If you are exploring where ESMFold2 could help your research, bring the question and the evidence you already have. We can discuss a focused study through the Crane Protein Intelligence Platform.
Inspect the data and scoring setup
The per-run JSON contains all 15 predictions' structural and confidence scores, normalization counts, and target dates. The DockQ scoring archive contains the predictions, five prepared references, chain-selection metadata, hashes, and a CPU-only verification script. It reproduces the published structural metrics without rerunning model inference. The settings below describe our study, not the authors' full benchmark protocol.
The archive does not reproduce ipSAE. It includes all 15 recorded output tables, but not the saved PAE arrays or exact scoring implementation. The JSON field interface_residues preserves n0res: the partner-chain residue count used for normalization at the alignment residue and direction that maximize ipSAE. It is not a total interface or residue-pair count.
Five runs have zero ipSAE because no inter-chain residue pair passes the PAE cutoff: the two incorrect 9VWO seeds and all three 9E7O seeds. This is not proof that no physical interface exists. Zero ipSAE does not by itself make pDockQ or pDockQ2 undefined; those metrics have their own contact definitions and are outside this comparison.
Download the per-run data (JSON)
Download the structures and DockQ scoring archive (ZIP)
| Model | ESMFold2 (ESMC-6B embeddings), open weights at huggingface.co/biohub/ESMFold2, revision 623490563d9e25221074976b586a303a4a1cc301 |
| Conditioning | Single sequence. No MSA, no template, no structural hints. |
| Sampling | Seeds 0, 1, 2. num_loops 3, num_sampling_steps 50, msa_column_mask_rate 0.0. |
| Scoring | DockQ 2.1.3 from PyPI, against the deposited structure, with fixed chain mapping AB:AB. A is the VHH and B the antigen. DockQ's ligand RMSD refers to the protein partner in this two-chain task. |
| ipSAE convention | Dunbrack ipSAE, d0res normalization, maximum of the two chain directions. Recorded output uses PAE cutoff 10 Å and distance cutoff 15 Å; the distance cutoff describes contact summaries and does not restrict the ipSAE calculation. |
| Chain preparation | References normalised to chain A (VHH) and chain B (antigen). Numeric author chain ids remapped, since 9UO0 uses chain 3 and DockQ raises on those. |
| Overlay superposition | Matched by sequence alignment, not residue number. ESMFold2 renumbers from 1 while deposited structures keep author numbering, so number-matching silently finds zero pairs. |
| Panel selection | Selected five-complex VHH panel. Filters, dates, and selection limits are documented below. |
How the reference complexes were selected
An RCSB query for full-text "nanobody", released after 2024-06, exactly two protein entities, and resolution better than 2.6 Å returned 91 hits. Filtering for one VHH-sized chain and one antigen chain, single copy each, left 20. The documented selection then took the most recent entries, with one entry per antigen family to limit repeated representation of the same antigen.
The archived script contains an explicit five-entry list consistent with that ordering after grouping Spike entries together. The screened 20-entry list is also included. We found no dated preregistration or record of selection blinded to prediction outcomes, so this remains a selected exploratory panel.
Deposition runs 2024-10-09 to 2025-07-17; public release runs 2025-03-19 to 2026-07-22. These dates follow the model card's reported September 2021 training cutoff. That date split does not prove the model has not seen close homologues: we have not audited the training corpus or distillation data, and ran no sequence or structural similarity check against the training set.
Our earlier workflow control, the lysozyme-binding VHH 1MEL, was deposited in 1996. It is excluded from this date-held-out panel.
Supporting analyses
Overlay alignment and offsets
These arithmetic all-atom centroid offsets describe four best-DockQ overlays after antigen alignment. They are not mass-weighted and use the same coordinates as DockQ, so they offer another view of the structural comparison rather than independent validation.
| Target | Offset after fit | DockQ |
|---|---|---|
| 9H1F | 1.5 Å | 0.923 |
| 9LAD | 1.7 Å | 0.889 |
| 9VWO | 2.4 Å | 0.823 |
| 9E7O | 17.2 Å | 0.067 |
9UO0 is excluded because the antigen fit has RMSD 13.4 Å. With that much disagreement in the alignment frame, a single nanobody centroid offset would obscure the structural differences.
Threshold sweep
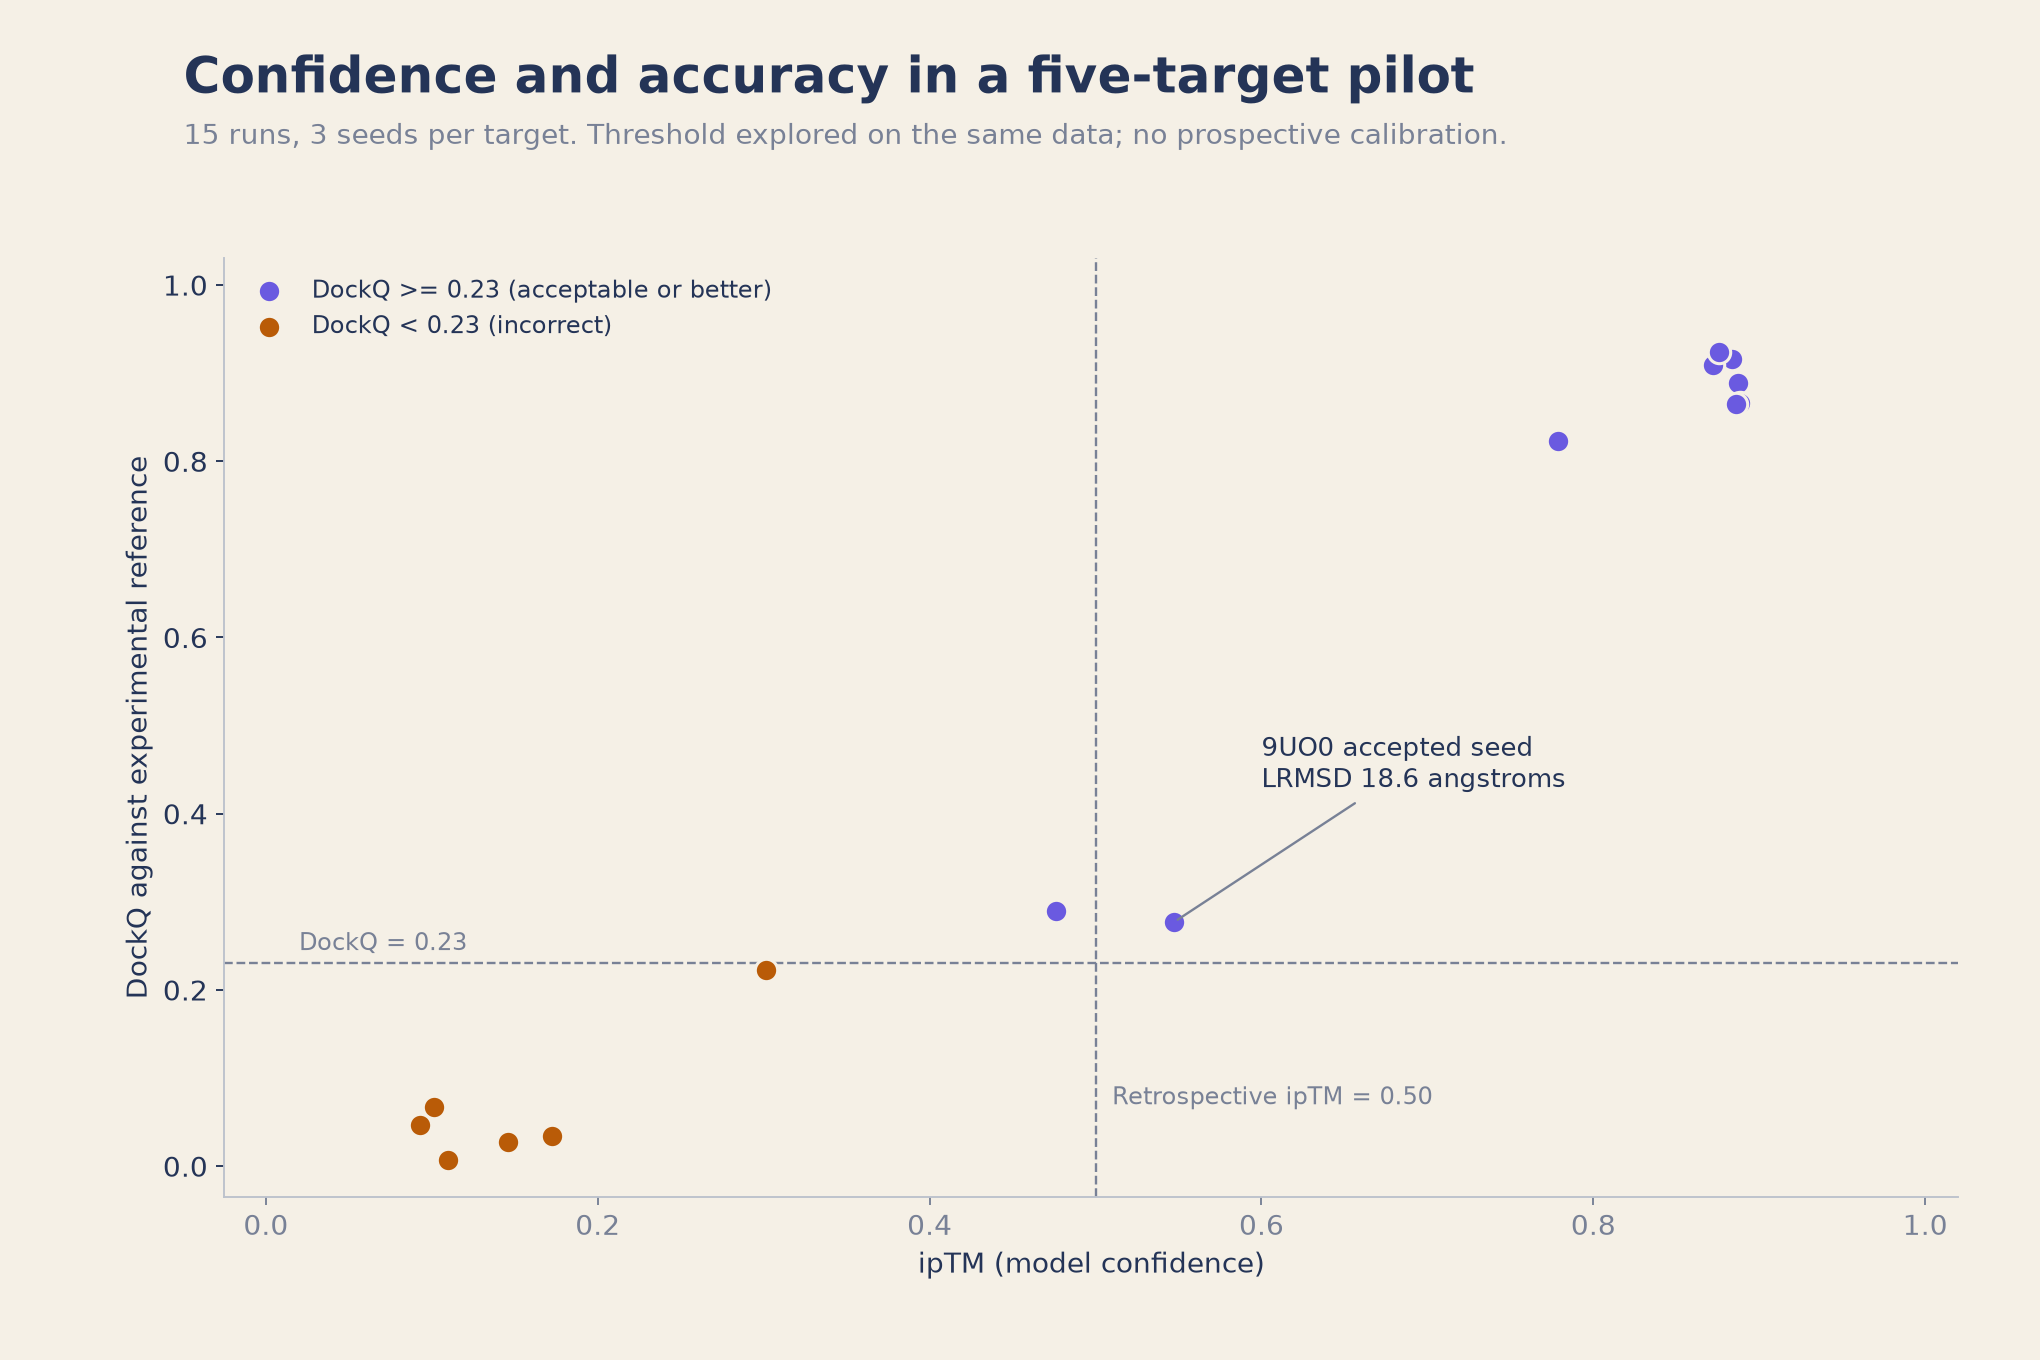
Selecting the highest-ipTM seed and applying a 0.5 cutoff accepted four targets at DockQ ≥ 0.23 and abstained on one. Only 3 of 4 accepted targets reached DockQ ≥ 0.80. At run level, the sweep below counts false accepts against the acceptable boundary, DockQ 0.23. A stricter structural endpoint changes that assessment.
| Gate | Runs accepted | DockQ ≥ 0.23 | False accepts |
|---|---|---|---|
| ipTM ≥ 0.3 | 10 | 9 | 1 |
| ipTM ≥ 0.5 | 8 | 8 | 0 |
| ipTM ≥ 0.8 | 6 | 6 | 0 |
Lowering the cutoff to 0.3 adds two runs, including one below DockQ 0.23. Raising it to 0.8 retains six high-quality runs. These subsets show the trade between coverage and required structural quality within this panel.
References
- Candido, S. et al. (2026). Language Modeling Materializes a World Model of Protein Biology. bioRxiv preprint, 10.64898/2026.06.03.729735. The ESMFold2 paper. biorxiv.org/content/10.64898/2026.06.03.729735
- Biohub. Model code, weights, and documentation. github.com/Biohub/esm and ESMFold2 Hugging Face model card
- Basu, S. & Wallner, B. (2016). DockQ: A Quality Measure for Protein-Protein Docking Models. PLoS ONE 11(8): e0161879. doi.org/10.1371/journal.pone.0161879
- Deposited reference structures, all from the RCSB Protein Data Bank: 9H1F, 9LAD, 9VWO, 9UO0, 9E7O.